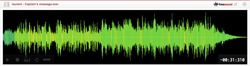
Click the little, "Change Display," icon above, and you'll see that this sound is, in fact, a self-portrait along the San Francisco city Skyline. The audio was generated through an interpolation process in which xy values were assigned to a photograph. The data was then interpolated as audio with varying frequency and amplitude according to color placement within that grid. (x = time, y = frequency.) The result is that you can listen to a picture of the San Francisco city skyline, or anything else for that matter.
You'll note that the image appears to be distorted within the spectrograph, this is because frequency is really a logarithmic value, thus the visual reproduction of the interpolated audio data will be squished.
Type
AIFF (.aiff)
Duration
0:53.479
File size
14.7 MB
Sample rate
48000.0 Hz
Bit depth
24 bit
Channels
Stereo
Comments

11 years, 10 months ago
Sweetness, I didn't realize that was available. Thanks so much for pointing that out!

12 years, 1 month ago
"Download this sound and play it through a spectrograph"
This Freesound preview has a spectrogram display option : click on the icon between "stop" and "loop", the icon looks like a bar chart.